Anatomy of a Real Detection: A Privilege Escalation Attempt, Caught Live
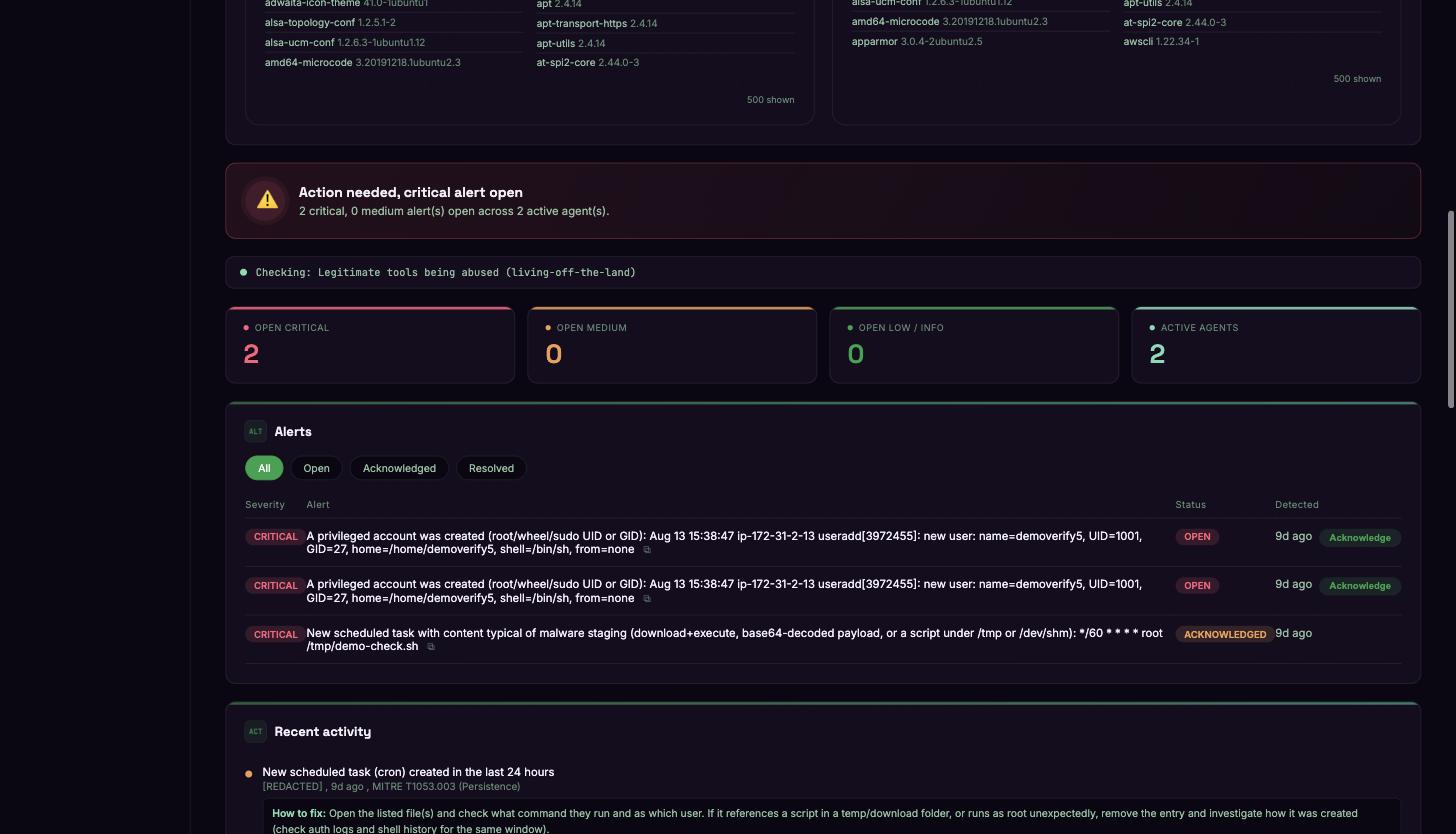
Most security tooling either drowns you in noise or stays quiet until it's too late. Here's what an actual detection looks like end to end, straight from a live Security Center dashboard.
It starts with the server map
The Solvbeat Agent runs on every monitored server and reports back continuously: uptime, disk usage, open ports, running services, installed packages. Nothing exotic — just a constant, honest picture of what's actually there.
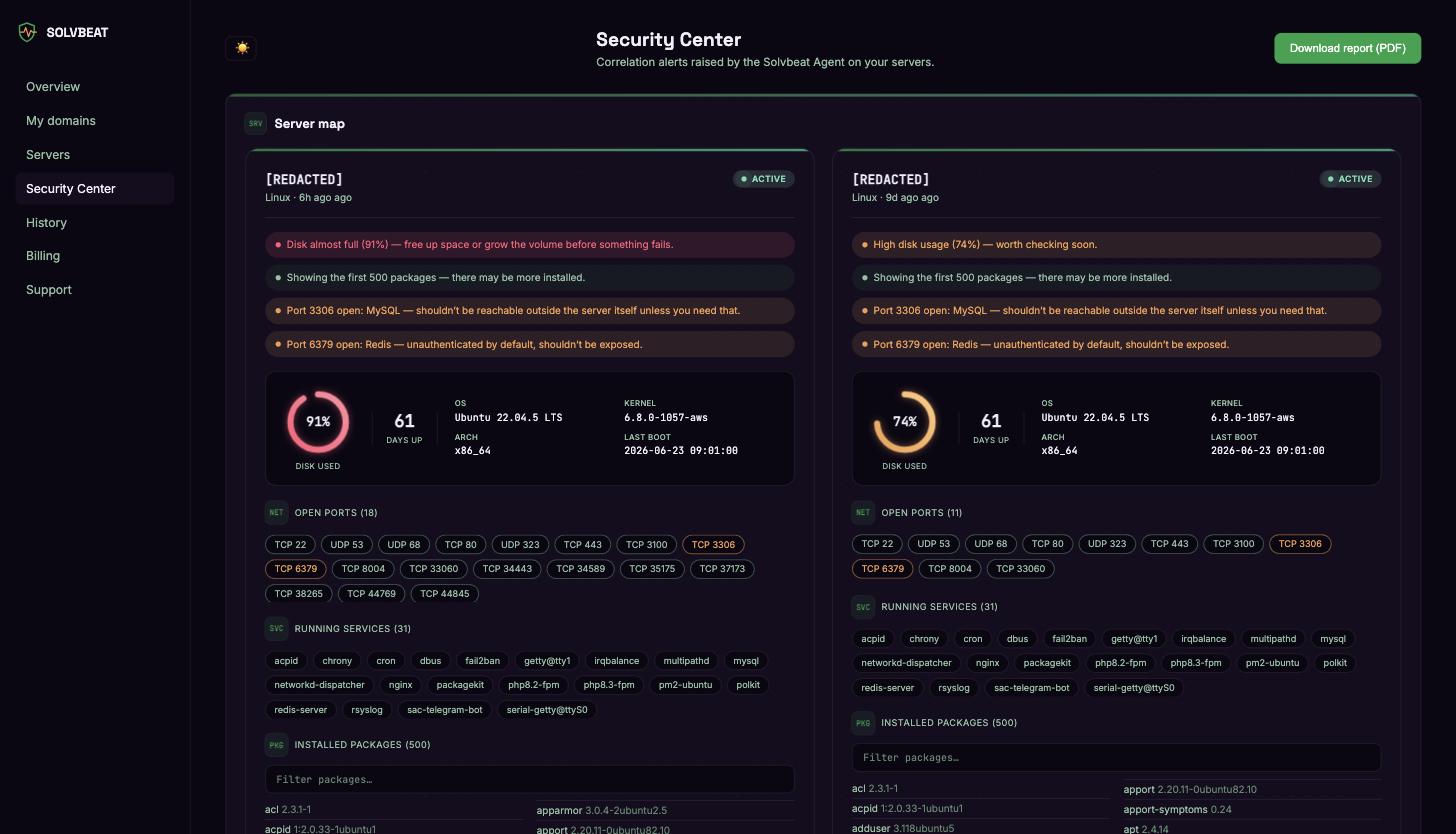
On one of the servers in this account, that baseline picture flagged two things worth a second look: disk usage creeping toward full, and a couple of ports (MySQL, Redis) open wider than they needed to be. Neither is an incident on its own — context is what turns observations into signal.
Two critical alerts, one story
Then the correlation engine did its job. Two separate signals landed within the same window, on the same host:
- A privileged account was created — a new user added to the root/wheel/sudo group, outside of any change window.
- A new scheduled task appeared with content typical of malware staging: a download-and-execute pattern, a base64-decoded payload, dropped under /tmp.
Individually, either alert might get triaged and forgotten. Together, on the same host, in the same window, they tell a much clearer story: something created persistence for itself, and it did it quietly.
From alert to investigation
This is where most tools stop — a list of alerts you have to manually stitch together yourself. The Security Center instead builds an investigation graph: the host, the account, the cron files, and the connections between them, laid out so the relationship is obvious at a glance instead of buried across three different log lines.
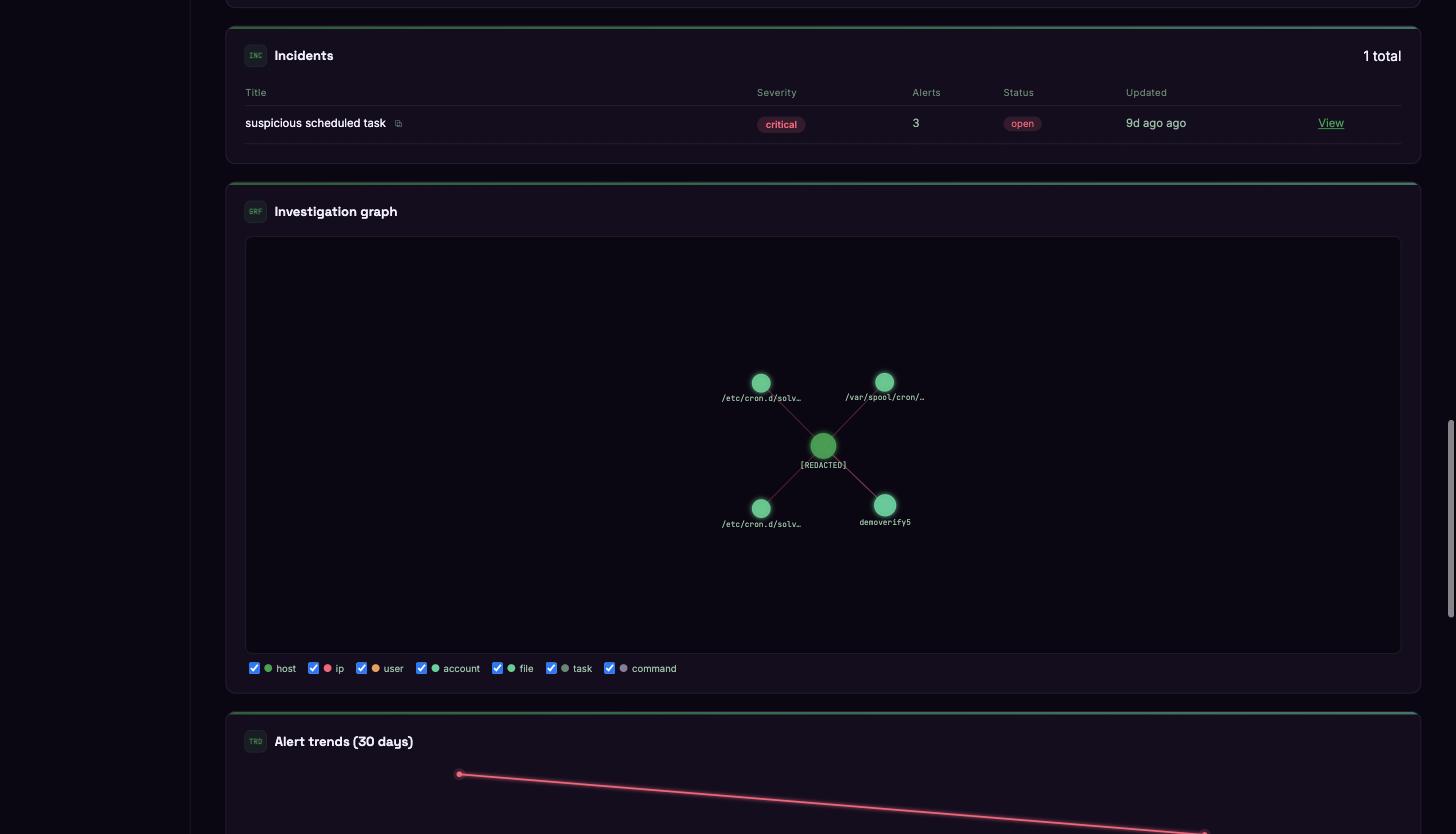
In this case, the graph made the "how to fix it" step almost mechanical: open the listed scheduled task, check what command it runs and as which user, and if it references a temp or download path, or runs as root unexpectedly, remove the entry and check auth logs and shell history for the same window.
Why this matters
This wasn't a synthetic demo dashboard — it's what a real account's Security Center actually caught, using nothing more exotic than an agent that watches disk, ports, services, packages, scheduled tasks and privileged accounts, plus a correlation layer that knows two odd things on the same host in the same hour are rarely a coincidence.
If you're running production servers and want the same visibility, see what's included or start your first scan free.